6 Sales Email Metrics That Matter

Contents
Cold email is one of the fundamental pillars of digital marketing. And there’s a reason it’s stayed so popular throughout the years: it works.
However, there’s a world of difference between simply using it, and using it to its full potential. To do that, you need to track, measure, and monitor.
Tracking the performance of your cold email campaigns offers you a wide range of critical insights, such as:
- Are your emails actually being delivered? If you’re seeing much lower open rates than you’d expect, there’s a good chance there’s a good chance they’re not.
- Which of your subject lines do your prospects find most compelling?
- Which of your CTAs are most likely to encourage readers to take action?
- What tone of voice and key messaging is generating the best response?
Metrics like these are absolutely critical to informing the strategy of your cold email campaigns. Simply put, if you aren’t tracking performance, you’re operating on guesswork – and chances are, you’re missing out on a ton of business as a result.
And when it comes to your sales emails, there are 6 metrics that matter most.
6 Sales Email Metrics to Track
1. Bounce Rate
Bounced emails are those that failed to reach the intended recipient.
Naturally, you want your email bounce rate to be as low as possible, but some bounces are inevitable – for instance, every time someone changes jobs, their old company email account will become inactive.
What’s a good cold email bounce rate?
As a general rule, your bounce rate should be under 3%. Most email service providers will penalize you if your bounce rate exceeds 5%, which will affect your ability to run future email campaigns.
Unless your bounce rate is literally 0% (which it probably isn’t), it’s in your interests to bring it down by cleaning your email list – in other words, trawling through your database of contacts and removing any inactive accounts. Done manually, this is a labor-intensive – and extremely dull – process, but fortunately Mailshake can do it all for you via Voila Norbert.
Tracking your cold email bounce rate is easy. You’ll get an email back every time one of your messages bounces, which you can use to compile a list of addresses to exclude from future campaigns. The tool you’re using to send emails should also give you a report of bounces.
2. Open Rate
2000 opens sounds great. An open rate of 72% is spectacular. But if they resulted in zero clicks, it just doesn’t matter. Many describe the open rate as a “vanity metric,” believing that it’s ultimately meaningless, just like tracking Facebook likes.

That’s not entirely wrong: opens and likes look good on a report, and give you a little ego boost (they like me, they really like me!), but they don’t pay the bills. A like or open is not a sale. Many consider tracking open rate a waste of time.
But ignoring it completely is not the answer, either. While your open rate should not be the only metric you track, it does provide some valuable insight, and there are many worthwhile ways to test and improve it.
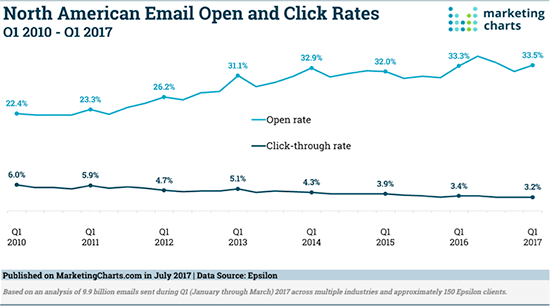
It’s best used as a comparative metric rather than a deciding factor. You can compare it to the industry average, your competition (if they publish that kind of information), and even your previous or concurrent campaigns. Is it better? Worse? Why? Hypothesize, test, and tweak accordingly.
And remember, when it comes to your opens, you should give more weight to your unique open rate. Otherwise, you’re counting each time the same person reopens your email.
What’s a good cold email open rate?
While averages vary from industry to industry, you should generally aim for an open rate of over 25%.
If your campaigns are consistently below that figure, you likely need to work on your subject lines, which are the single biggest factor in whether or not a recipient chooses to open an email. There are plenty of best practices around writing effective cold email subject lines. If you aren’t already, try the following:
- Add personalized elements such as the recipient’s first name and/or company name
- Write shorter subject lines so they aren’t truncated by certain devices or email clients
- Make your language more casual to engage your audience
- Mention a shared interest, such as a mutual connection
Optimize campaign performance by A/B testing different subject lines so you can establish what works best (and what definitely doesn’t).
Your email tool of choice should be generating an open rate report every time you run a campaign, so tracking shouldn’t be a challenge. However, if this isn’t happening, you can download a third-party email open-tracking tool like Right Inbox.
3. Cold Email CTA
Every email you send needs a call-to-action (CTA). You want them to do something.
Often, those CTAs will be connected to a link of some sort – taking the user to a dedicated landing page – but they might be driving a different sort of action, such as replying to the email. Either way, you should only have one CTA per email; it needs to be completely obvious to the reader what action you want them to take.
Whatever your desired action, you need to know how many people are following your CTA. Why? For starters, it reflects the appeal and power of your CTA, and it takes you one step closer to improved conversions (whatever that happens to be for each email).
What’s a good cold email CTA?
Somewhere in the 2-4% range is decent, but the best reach 10-15% or higher. That should be your goal. Never settle for average. And once again, be sure to differentiate between “total” and “unique” actions for a more accurate figure.
If you’re falling short of that figure, there could be a range of issues with your cold email campaigns, from the quality of your audience list to the tone of your copy. There’s too much for us to go into in this article, but you can find everything you need to know in our comprehensive guide to email strategy.
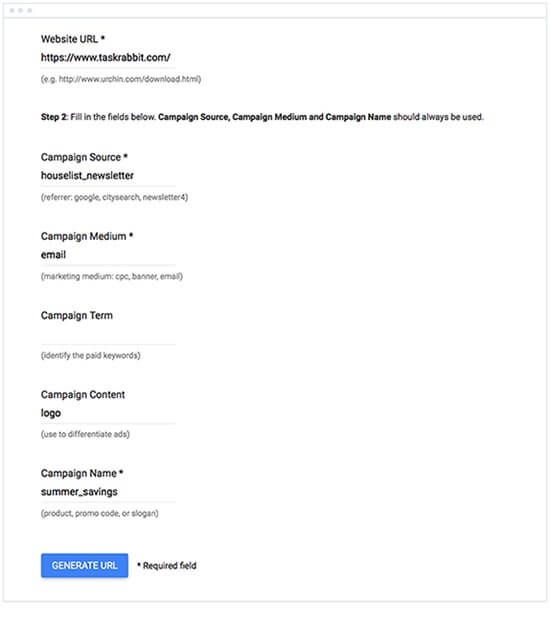
Measuring the effectiveness of your CTAs means paying attention to a couple of different metrics. Specifically, you’ll want to track your number of replies and number of clicks. Again, your email tool should be able to produce these reports for you, but otherwise you can add UTM tracking – or use a tool like bit.ly – to track link-clicks yourself.
4. Click-to-open Rate (CTOR)
We’ve already established that a high open rate is nice, but really only useful as a comparative metric. A high CTR is better, as you need them to click so you can (eventually) sell them.
Putting those two together can prove tremendously valuable. The click-to-open rate compares the number of people who clicked to the number who opened. Calculate it quickly with a very simple formula: (unique clicks / unique opens) x 100.
[15 (unique clicks) / 53 (unique opens)] x 100 = 28.3%
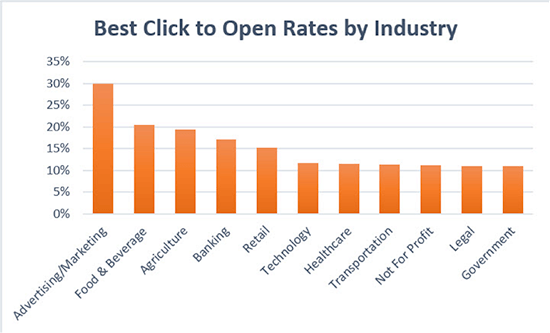
As with the other metrics, it varies by industry. The overall average for the first half of 2017 was 11%, but it was nearly 3x that – 30% – for advertising/marketing.

The CTOR cuts through the noise and measures the quality of the email content and CTA. Nothing else.
The CTR gives a big picture evaluation of your campaign (including subject lines, personalization, and more), while the CTOR evaluates the email content alone, as it only works with the number of people who react and engage with your email message once they’ve decided to open it.
Comparing them is a useful exercise.
5. Disengagement Rate
Your disengagement rate is the sum of your unsubscribes and spam complaints.
In essence, it measures how successfully your emails are working to engage your audience. Those actively unsubscribing or complaining are not just evidence of disengagement, but that something is very, very wrong. They just don’t dislike it. They hate it.
To find it, add the unsubscribes and spam complaints divided by unique opens:
[3 (unsubscribes) + 2 (spam complaints) / 4100 (unique opens) = 0.12%
Most experts recommend keeping your disengagement rate below 0.15%. Too high for too long, and your overall deliverability will start to suffer. You can’t make everyone happy all the time. Unsubscribes and complaints will happen. Just actively track and manage them.
6. Conversion rate
This is what it’s all about: the earnings. If your sales campaigns aren’t earning, what’s the point?
Your earnings per click (or per email) gives you a quick and easy snapshot. Dollars and cents. Is it working (i.e. bring in the cash)?
Track and measure regular sales campaigns, coupon/discount campaigns, special theme or holiday campaigns, and more. Set a conversion goal, measure revenue generated, and track emails. You can use native tracking tools within your marketing and sales provider, or by adding a simple UTM parameter to links. Either way, you want to determine which emails make your recipients reach for their credit card.

What’s a good cold email conversion rate?
Ultimately, conversion metrics are all about measuring the proportion of recipients who took the action you wanted after reading your email. Tracking it will therefore depend on what that action was – and may need to be tracked manually.
The CTA might be “Request your custom demo today,” but if the conversion is them actually signing a deal, you’ll need to track that offline. However, if it’s a case of them signing up on your website, you’ll be able to track that number in Google Analytics.
There are many metrics. These 6 represent a good jumping off point.
So jump.


